Don’t Overpay AWS Bill: NAT Gateway vs VPC Endpoint, Find Break-Even Point
My previous article on AWS Account Dilemma reveals the best practice how to manage AWS accounts for multiple stages.
While separating the stages into isolated AWS accounts is the gold standard for security, duplicating NAT Gateways or 5+ interface endpoints across every single account will tank the budget if we don't calculate the data thresholds first. So the question:
Which one is cheaper, NAT Gateways or VPC interface endpoints?
This article answers that question, finding the break-even points of data processed, showing the logic behind the scene.
I created a calculator which one to choose from NAT gateway and interface endpoints.
Pricing
In the U.S. North Virginia region, as of June 1, 2026:
| Hour | Data processed | |
|---|---|---|
| NAT Gateway | $0.045 / hour | $0.045 / gb |
| Interface endpoint | $0.010 / hour | $0.010 / gb |
The gateway endpoints for Amazon S3 and DynamoDB are free. The discussion below on break-even point only applies to interface endpoints—Systems Manager, ECR, CloudWatch Logs, Secrets Manager, etc.
Because the hourly cost of 4.5 interface endpoints equals the hourly cost of one NAT Gateway, less than five of interface endpoints are always cheaper than NAT Gateway. There is no complexity here. The complexity emerges when we have 5+ interface endpoints.
Formula
Given the number of endpoints(NE), the formula to calculate the break-even point(GB) is:
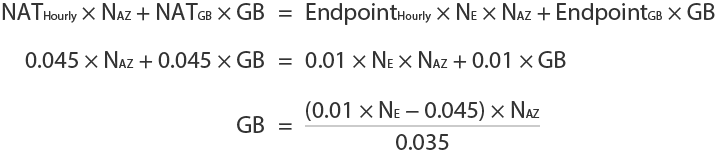
One way to look at this formula is that we first find the break-even point for one AZ, then multiply the result by the number of AZs.
Break-Even Points
The figure below illustrates the cost relation between NAT Gateway and number of interface endpoints. The point where two lines—one for NAT Gateway, another for interface endpoints—cross is the break-even point.
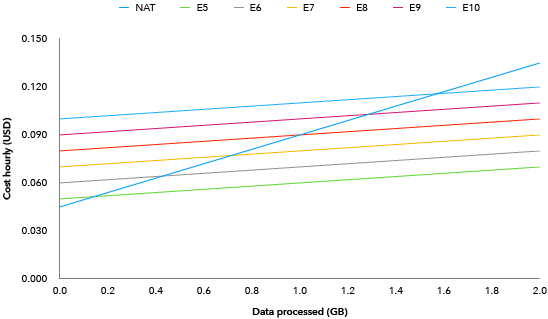
The amount of data processed at each break-even point is listed in the following table.
| Number of Endpoints | Number of AZs | ||
|---|---|---|---|
| 1 | 2 | 3 | |
| 5 | 0.14 | 0.29 | 0.43 |
| 6 | 0.43 | 0.86 | 1.29 |
| 7 | 0.71 | 1.43 | 2.14 |
| 8 | 1.00 | 2.00 | 3.00 |
| 9 | 1.29 | 2.57 | 3.86 |
| 10 | 1.57 | 3.14 | 4.71 |
Multiplying 24 hours × 30 days (= 720 hours) to the values in the table above, we obtain the monthly break-even points.
| Number of Endpoints | Number of AZs | ||
|---|---|---|---|
| 1 | 2 | 3 | |
| 5 | 103 | 206 | 309 |
| 6 | 309 | 617 | 926 |
| 7 | 514 | 1,029 | 1,543 |
| 8 | 720 | 1,440 | 2,160 |
| 9 | 926 | 1,851 | 2,777 |
| 10 | 1,131 | 2,263 | 3,394 |
For the hourly table, the values are rounded to the nearest hundredth. For the monthly, the values are rounded to the nearest whole number.
Monthly Costs
Given the amount of data processed at each break-even point, we can obtain the monthly cost as well.
| Number of Endpoints | Number of AZs | ||
|---|---|---|---|
| 1 | 2 | 3 | |
| 5 | $37.03 | $74.06 | $111.09 |
| 6 | $46.29 | $92.57 | $138.86 |
| 7 | $55.54 | $111.09 | $166.63 |
| 8 | $64.80 | $129.60 | $194.40 |
| 9 | $74.06 | $148.11 | $222.17 |
| 10 | $83.31 | $166.63 | $249.94 |
Conclusion
Excluding endpoints to S3 and DynamoDB, if we have more than four VPC interface endpoints, and the amount of data process is lower than 103 gb per AZ, NAT Gateways are always cheaper than VPC interface endpoints.
Key Takeaways
- The “Low-Traffic Sandbox” Trap: If we have a staging environment that sits idle most of the time but references ten different interface endpoints across three AZs, we are burning over $200/month just in idle endpoint base fees. For low-traffic environments, routing everything through a single NAT Gateway is often cheaper.
- The “High-Data Analytics” Winner: If our application is streaming gigabytes of metrics to CloudWatch Logs or pulling massive Docker images from ECR constantly, interface endpoints will cut our data bill by over 77% compared to running that data through a NAT Gateway.